Oday Bakkour Logo
Back to Alternatives

Open Source Alternatives to

NewRelic

4 Alternatives

Netdata

Real-time observability and monitoring

Observability and monitoring

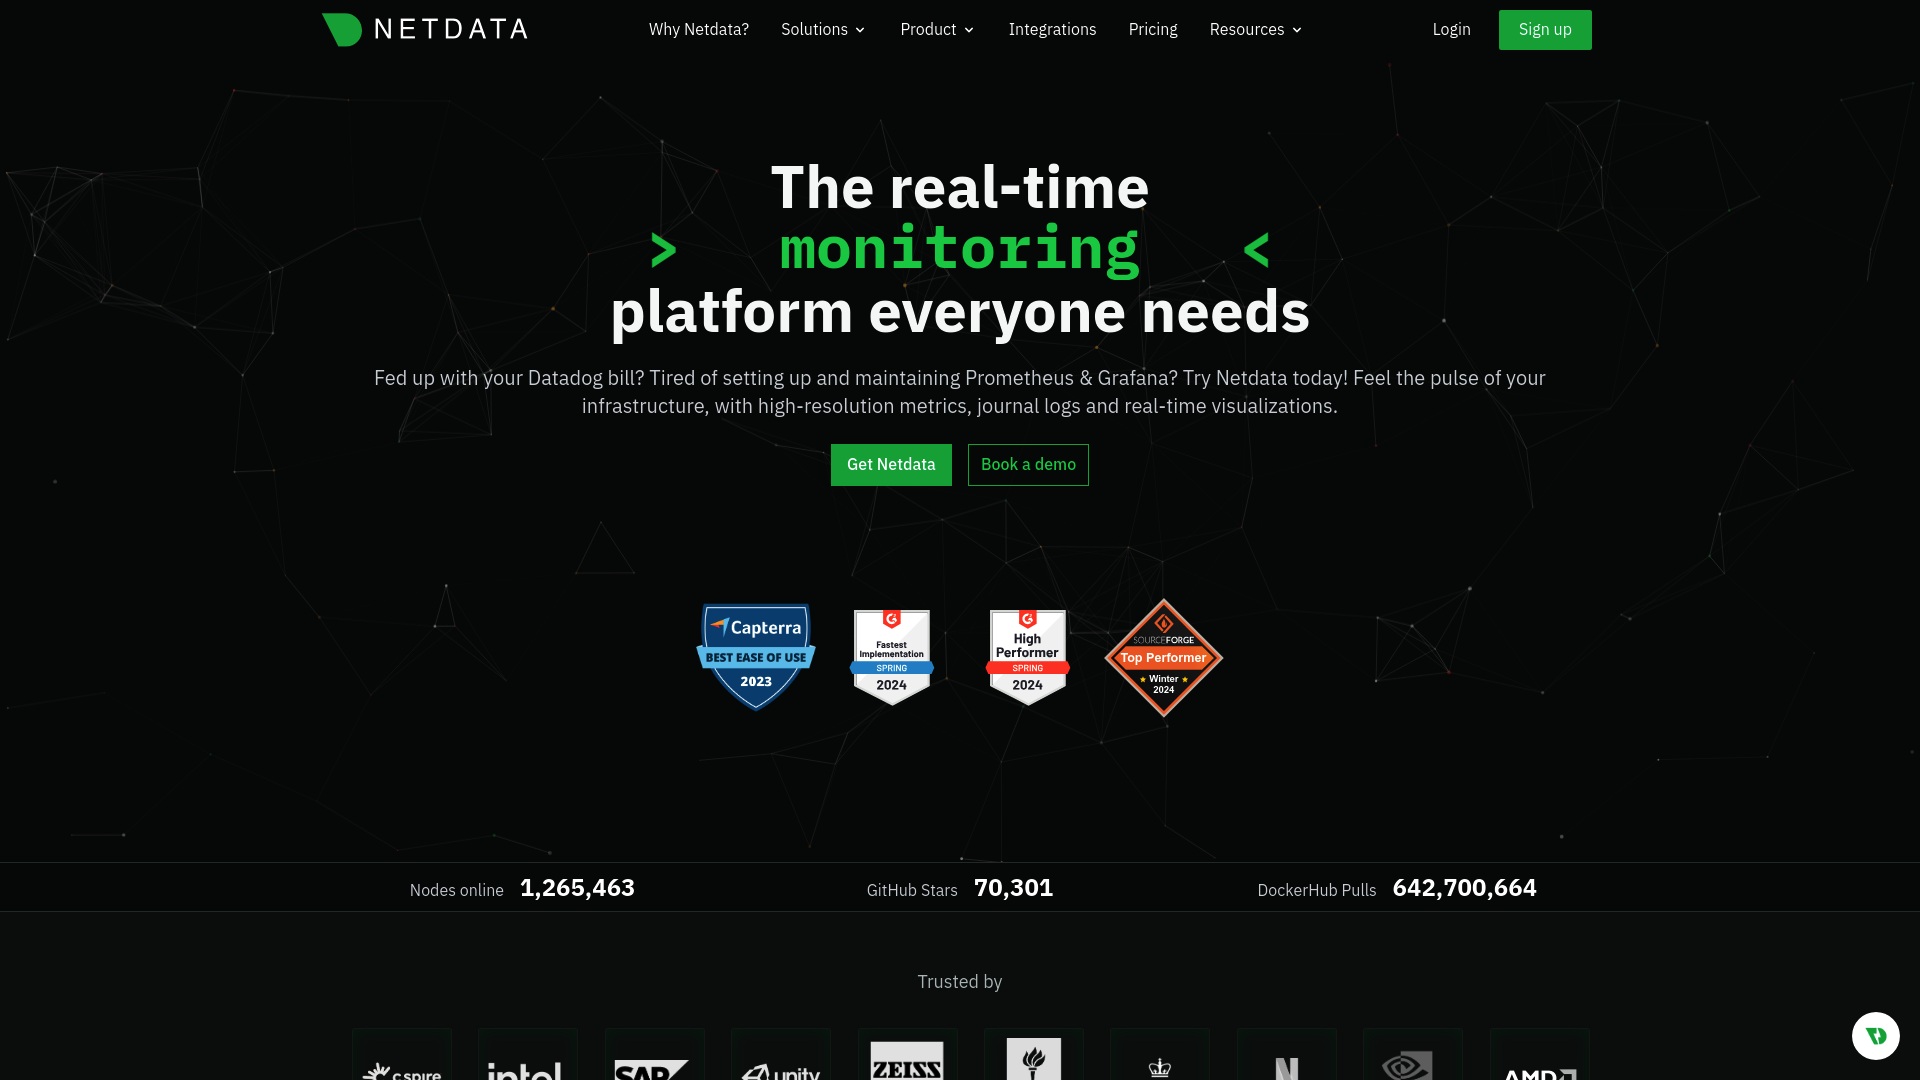
High-resolution metrics, real-time visualizations, and affordable monitoring.

78.1kstars6.4kforks587contributors152issuesLast commit 3d ago
Read more about Netdata

Netdata is a real-time observability, monitoring, and troubleshooting platform designed to simplify and optimize IT operations. It provides high-fidelity data, real-time visualizations, reliable alerts, and anomaly detection for every metric, offering an affordable and out-of-the-box monitoring experience. Netdata's core is open-source, ensuring transparency and flexibility for users. Here’s what makes Netdata exceptional:

High-Fidelity Data: Collects and visualizes high-resolution metrics in real-time.
Real-Time Visualizations: Offers interactive charts that update every second, providing immediate insights.
Reliable Alerts: Automatically sends alerts about anomalous behavior or performance degradation.
Anomaly Detection: Utilizes machine learning to detect anomalies for every metric.
Open-Source Core: The Netdata Agent is open-source, encompassing the database, query engine, and more.
Scalability: Supports both vertical and horizontal scalability, suitable for various environments including on-premises, cloud, and hybrid.
Easy Installation: Install with a single command and zero configuration, gaining access to thousands of metrics instantly.
Data Privacy: Ensures that your data is stored on your systems, with ephemeral querying from Netdata Cloud.
Extensive Integrations: Integrates with hundreds of systems and applications, offering a broad range of data collectors.

Netdata transforms monitoring by providing a comprehensive, easy-to-use solution that delivers real-time insights and reliable performance data, all while maintaining affordability and simplicity.

Grafana

Unified observability and visualization platform

Observability and monitoring

Open-source platform for metrics, logs, and traces.

72.7kstars13.6kforks2.9kcontributors3.3kissuesLast commit 1d ago
Read more about Grafana

Grafana is an open-source, composable observability and data visualization platform that allows you to query, visualize, and alert on metrics, logs, and traces from multiple data sources. It integrates seamlessly with a wide array of backends like Prometheus, Loki, Elasticsearch, InfluxDB, and Postgres, among others, enabling a unified view of your entire stack.

Metrics Visualization: Query and visualize metrics from sources like Prometheus and Graphite.
Log Aggregation: Aggregate and search logs with Grafana Loki.
Tracing: Distributed tracing with Grafana Tempo.
Dashboarding: Create and share customizable dashboards.
Alerting: Set up and manage alerts to stay ahead of issues.
Plugins: Extend Grafana’s capabilities with a wide variety of plugins.
Synthetic Monitoring: Monitor API and web application performance.
Continuous Profiling: Profile application performance with Grafana Pyroscope.
Incident Management: Manage incidents with Grafana OnCall and Grafana Incident.
Frontend Observability: Gain insights into frontend performance with Grafana Faro.

Grafana’s flexibility and wide range of integrations make it an indispensable tool for modern observability, catering to both small teams and large enterprises.

Signoz

Unified observability platform

Observability and monitoring

Open-source APM with logs, traces, metrics.

26.1kstars2.0kforks148contributors1.3kissuesLast commit 3d ago
Read more about Signoz

SigNoz is an open-source observability platform designed to provide comprehensive Application Performance Monitoring (APM). It combines logs, traces, metrics, exceptions, and alerts in a single tool, offering a robust alternative to commercial solutions like Datadog and New Relic. SigNoz is built from the ground up to be OpenTelemetry-native, ensuring seamless integration and future-proofing for evolving technologies. You can choose to self-host SigNoz or use its cloud services based on your specific needs.

Metrics: Track key performance indicators to monitor the health of your applications.
Traces: Follow requests across various services to identify bottlenecks and performance issues.
Logs: Aggregate and analyze logs for deeper insights into system behavior and issues.
Dashboards: Create custom dashboards to visualize metrics, traces, and logs in real-time.
Errors: Detect and diagnose errors quickly to improve system reliability.
Alerts: Set up alerts to get notified about critical issues and performance anomalies.

SigNoz leverages ClickHouse, a highly optimized storage solution used by industry giants like Uber and Cloudflare, to ensure fast and efficient data ingestion and querying. Its DIY query builder supports PromQL and ClickHouse queries, providing flexibility for diverse use-cases. With OpenTelemetry’s extensibility, SigNoz offers a standardized approach to observability, eliminating vendor lock-in and enhancing developer productivity. Trusted by teams worldwide, SigNoz is built for scale, capable of handling massive data ingestion while maintaining enterprise-grade security and compliance. Its transparent, usage-based pricing model ensures cost predictability without hidden fees, making it a preferred choice for many organizations.

VictoriaMetrics

Fast, scalable monitoring solution

Observability and monitoring

High-performance, cost-effective time series database.

16.5kstars1.6kforks271contributors697issuesLast commit 3d ago
Read more about VictoriaMetrics

VictoriaMetrics is a high-performance, open-source time series database and monitoring solution. It is designed to handle large-scale metrics data with ease, providing a reliable and scalable infrastructure for monitoring and observability needs.

High Performance: VictoriaMetrics excels in processing and querying large volumes of time series data quickly and efficiently.
Cost-effective: The solution is optimized for cost-efficiency, making it a budget-friendly choice for organizations of all sizes.
Scalability: VictoriaMetrics supports horizontal scalability, allowing it to grow seamlessly with your data and infrastructure needs.
Cloud-readiness: It is designed to be easily deployable in cloud environments, making it suitable for modern cloud-native applications.
Long-term Metrics Storage: The database provides robust long-term storage capabilities, ensuring that historical data is retained and accessible for analysis.
Easy to Configure and Operate: With straightforward setup and maintenance processes, VictoriaMetrics minimizes the operational overhead for your team.

VictoriaMetrics combines high performance, scalability, and cost-efficiency, making it an ideal choice for organizations looking to implement a reliable and effective monitoring solution.